Remote Sensing products enable the inspection of rapid syn- and post-hazard event damage of the CH assets in the historic areas. For this purpose, a flood monitoring method and the respective tool have been developed for mapping flood areas. Some result examples, of the application of this tool, are shown for Venice (Italy) and Kragero (Norway).
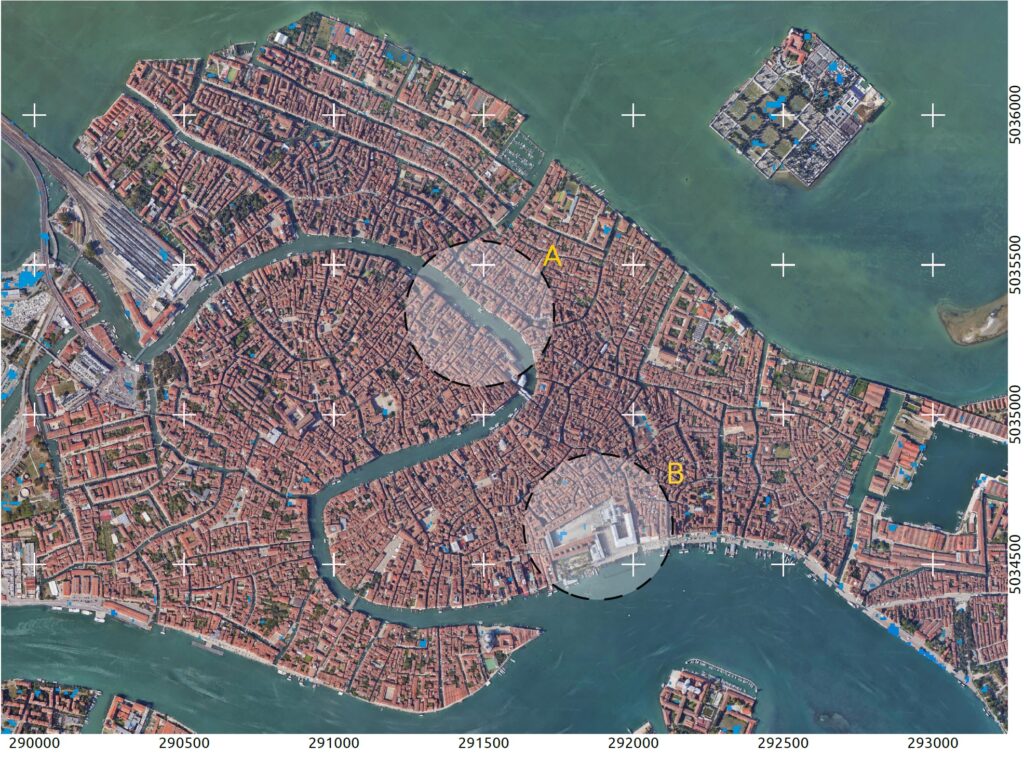
Figure 1. Flood map, Venice, Italy.
Map Information:
Since November 12th, 2019 the Veneto region was affected by a deep cyclonic circulation resulting in an intense phase of severe weather over the Italian peninsula. The severe weather conditions caused a high tide in Venice, reaching the maximum value of 187 cm at 10:50 p.m. of November 12th, 2019. The purpose of the map (Fig. 1) is to create the flood map in the vicinity of the two selected Cultural Heritage monuments in Venice. The key user of this map is the municipality of Venice.
Cartographic Information: Full Color, High resolution (300dpi)
Data Sources
Flood products based on: Sentinel-1 dataset of 3 images (descending track, Relative orbit 95) C band, 5.546 cm wavelength.
Elevation data – SRTM 1 Arc-Second Global (30m resolution)
Vector Layer: Monument Building Footprints
Background image: Google Earth Imagery 2020
22_Oct_2019 – Before Flood, 28_Oct_2019 – Before flood, 15_Nov_2019 – Flood
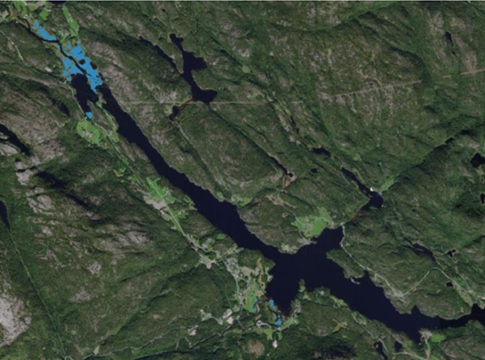
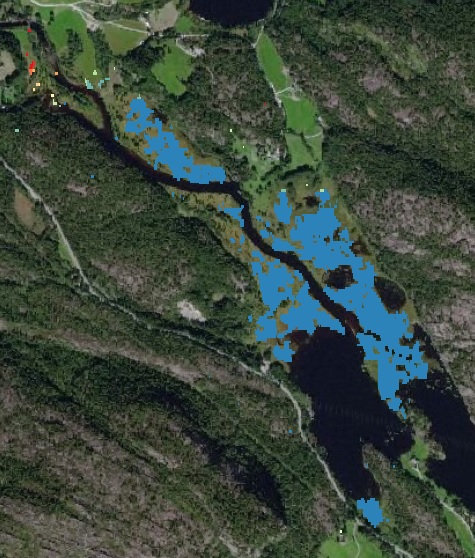
Figure 2: Flood monitoring: Kragero, Norway (107km from Tønsberg) (a), (b), (c): Flood monitoring in the broader area of Kragero. (d), (e),(f): Zoom in the flooded area.
Flood information
Heavy rains in the Kragero region have raised an orange level flood alert in the area on October 22nd, 2017. In such cases landslide events are expected, some with considerable consequences, as well as extensive flooding, erosional damage and flood damage in prone areas. The purpose of these maps is to monitor the flood evolution.
Data Sources
Flood products based on: Sentinel-1 dataset of 7 images (ascending track, Relative orbit 44) C band, 5.546 cm wavelength.
Elevation data – SRTM 1 Arc-Second Global (30m resolution)
Background image: Google Earth Imagery 2020
22_Oct_2017 – Flood, 28_Oct_2017 – After flood, 03_Nov_2017 – After flood
